Introduction
Problem
Goals
Research
Ideation
Testing
Outcome
Several users reported friction when trying to calculate scope 2 market-based vs. location-based emissions. Emissions sources in our system previously allowed only one emissions factor and scope category pairing. This limitation forced users to manually duplicate utility data just to create a second emissions record with a different emissions factor.
The problem was especially frustrating for users who appreciated the automation between EnergyCAP meters and emissions sources. We aimed to remove this manual step and enhance the flexibility of emissions tracking—without requiring users to restructure their data or workflows.
Role: UI/UX Designer
Tools: Figma, Miro, Maze
Users had to manually copy utility data to create separate emissions records for different scope 2 reporting needs. This process was repetitive and error-prone.
Why it mattered:
Automating this process would improve accuracy, save time, and reduce frustration. It also supported more compliant and complete emissions reporting.
Eliminate the need for users to manually duplicate records
Enable tracking of multiple emissions types from a single EnergyCAP meter
Reduction in manual record creation
We conducted user interviews with current customers to understand how they imported and processed emissions data. These conversations highlighted two potential paths forward:
Allow a single EnergyCAP meter to link to multiple emissions sources
Allow an emissions source to support multiple emissions factor and scope category pairs
We explored both design directions in low and mid fidelity wireframes and prototyped each approach in Figma.
Linking one meter to two emissions sources provided clear separation but introduced more complexity to the UI and data management.
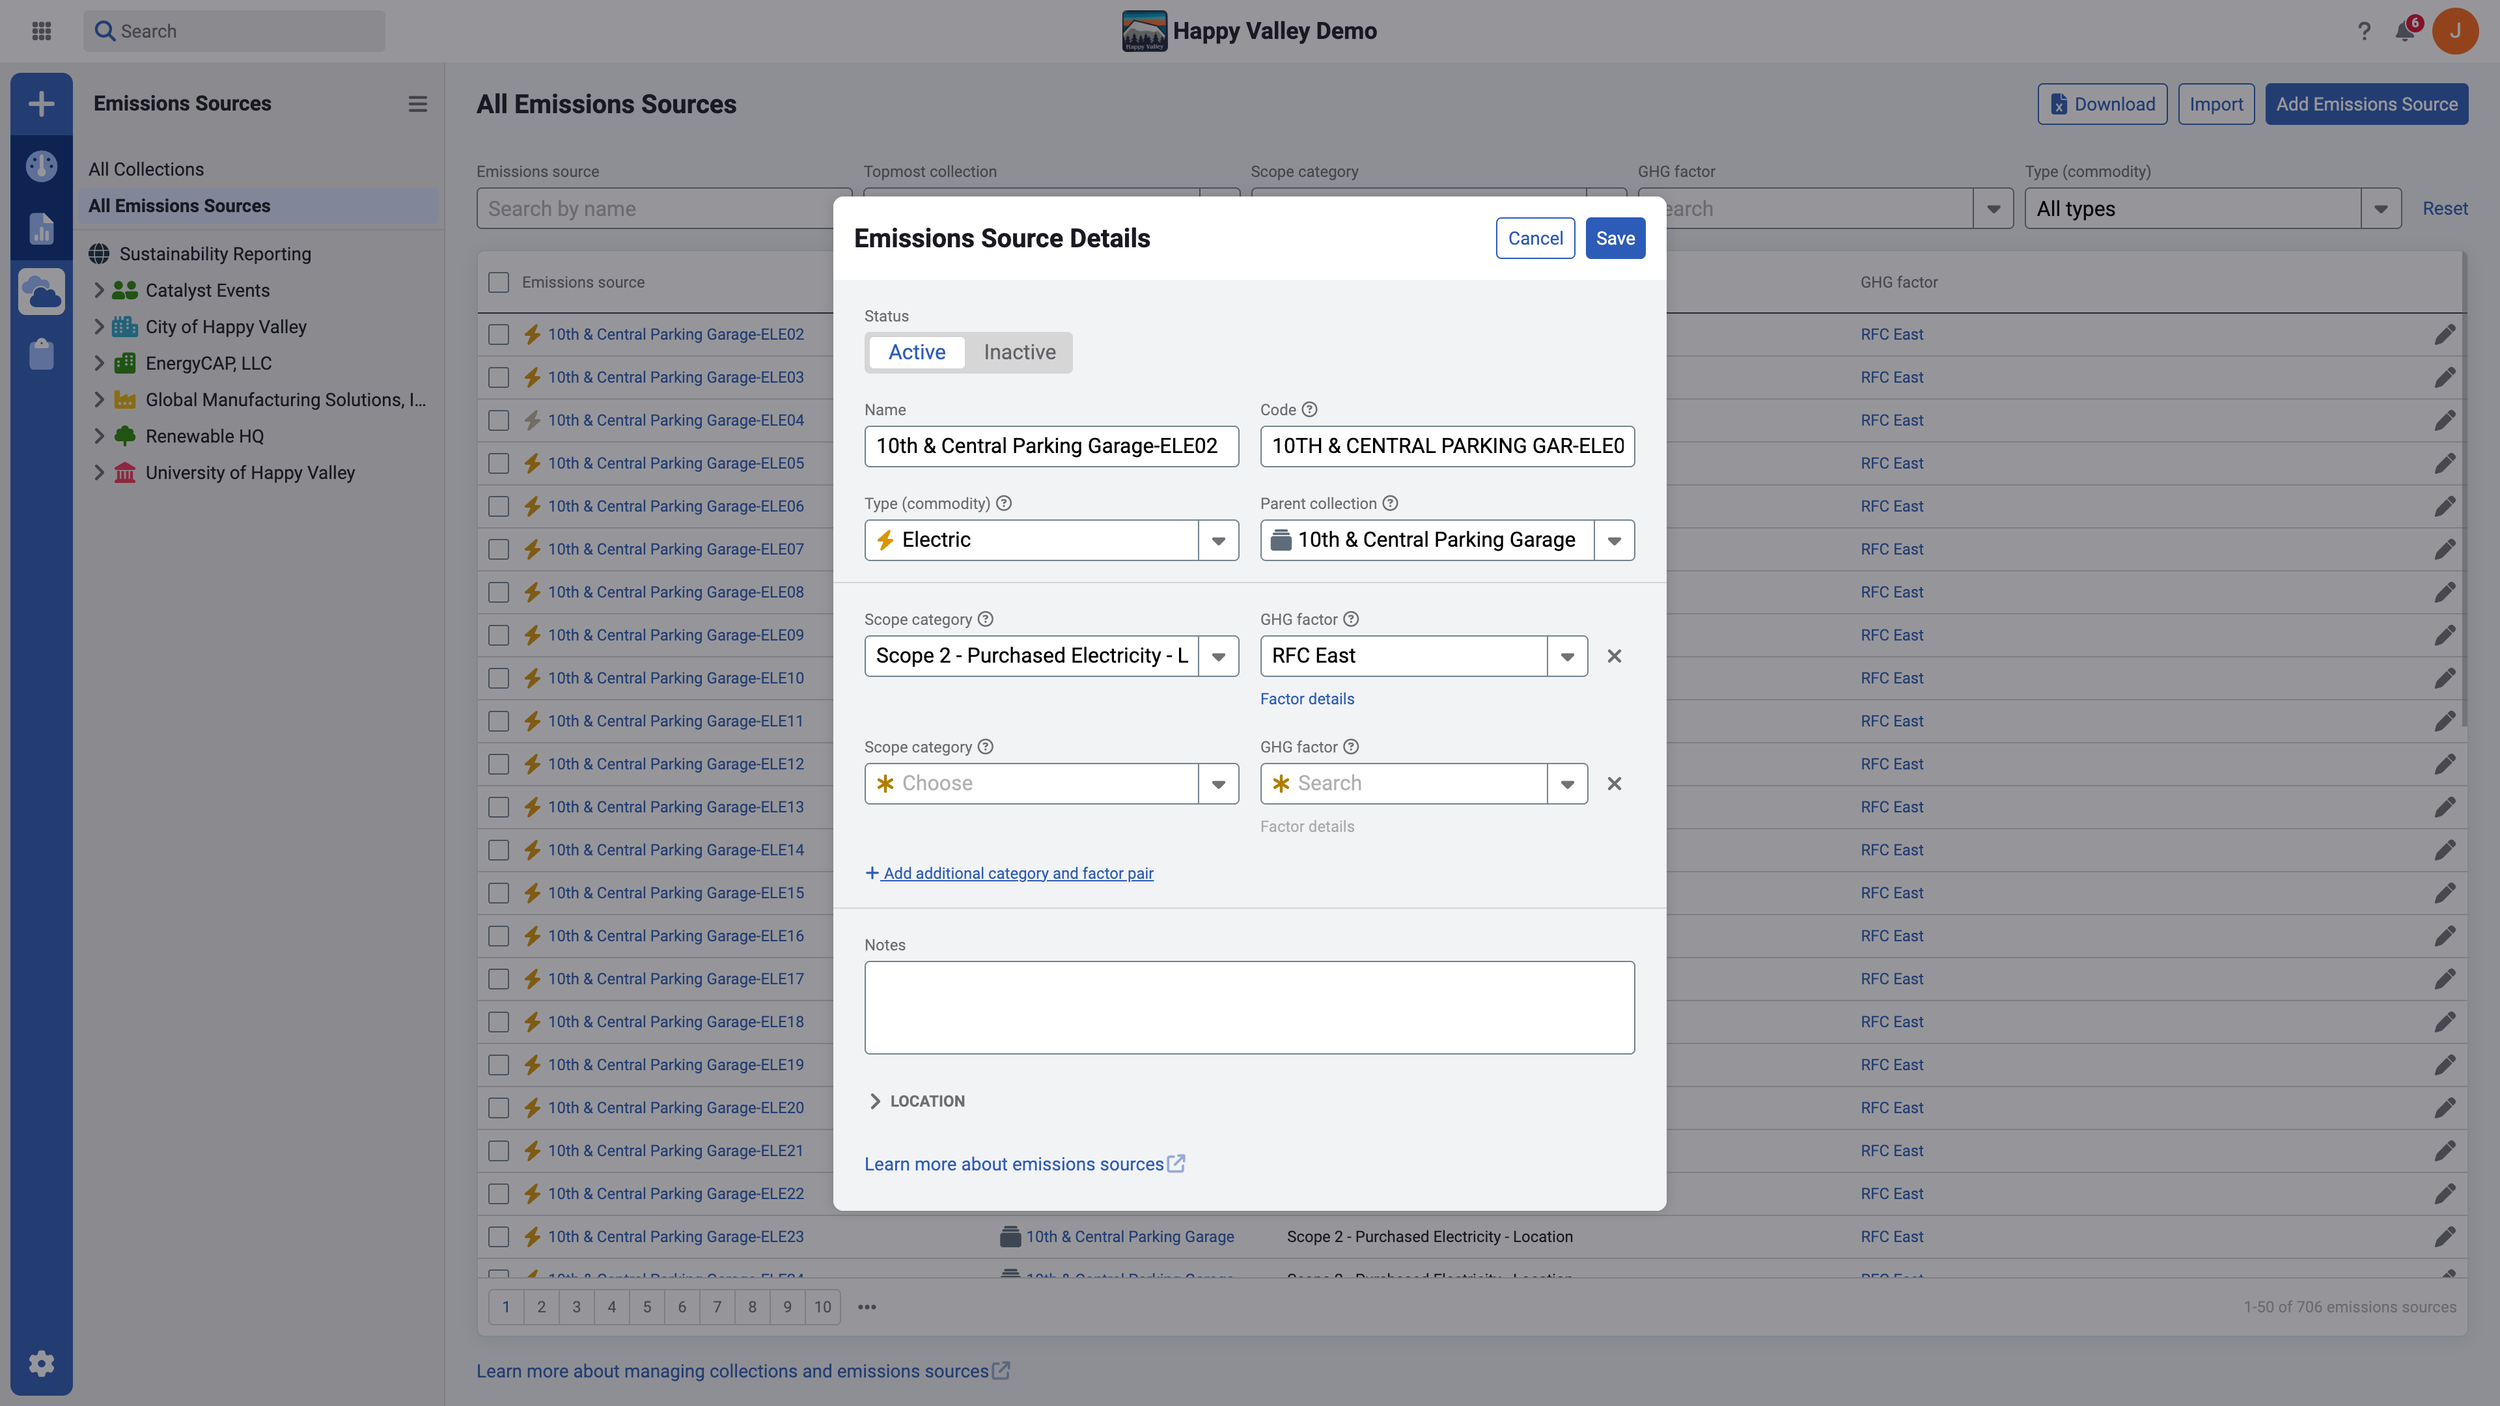
Allowing multiple emissions factor and scope category pairs within a single emissions source offered greater flexibility while keeping the experience clean and familiar.
We took both concepts back to users and stakeholders for feedback.
Key turning point:
After presenting both options, we chose to move forward with the multi-pair emissions source based on strong user preference and reduced complexity.
We tested our designs with:
Existing users (1:1 walkthroughs)
Internal stakeholders
Broader audiences via Maze for discoverability and usability
What we learned:
Users appreciated the ability to manage scope 2 variants without duplicating data
We should pursue bulk-editing tools and defaults by commodity
Maze tests confirmed that users could easily understand and apply the new design
The final solution included:
Support for multiple scope category and factor pairs within a single emissions source
A new bulk edit tool to apply multiple pairs to groups of emissions sources
A default configuration system based on commodity type, speeding up new source creation
Impact:
Reduced manual work for emissions tracking
Increased alignment with reporting standards